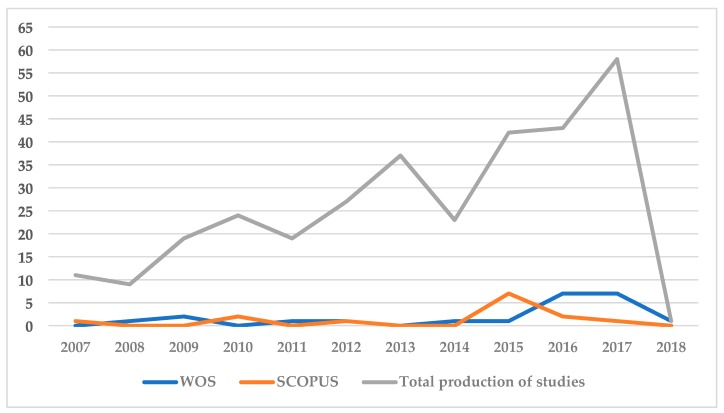
Figure 2.
Evolution of scientific production. Vertical axis, number of articles published; Horizontal axis, year of publication; Grey line, total number of relevant articles identified from Web of Science (WOS) and SCOPUS to be analyzed; Blue line, selected articles from WOS; Orange line, selected articles from SCOPUS.

