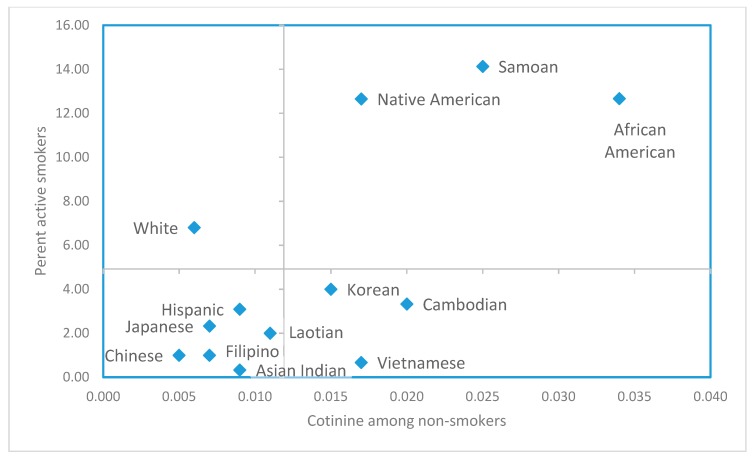
Figure 1.
Percent active smokers (N = 3329); vs geometric mean serum cotinine levels in non-smokers (N = 3180); prenatal screening program enrollees in 13 race/ethnic groups; San Diego, Orange and Imperial counties. (Smoking status defined by race- and age-specific cutpoints per Benowitz et al. 2008 [39]. Grid lines show the mean of percent active smokers in the 13 race/ethnic groups and the antilog of the mean log cotinine in non-smokers in the 13 groups.)

