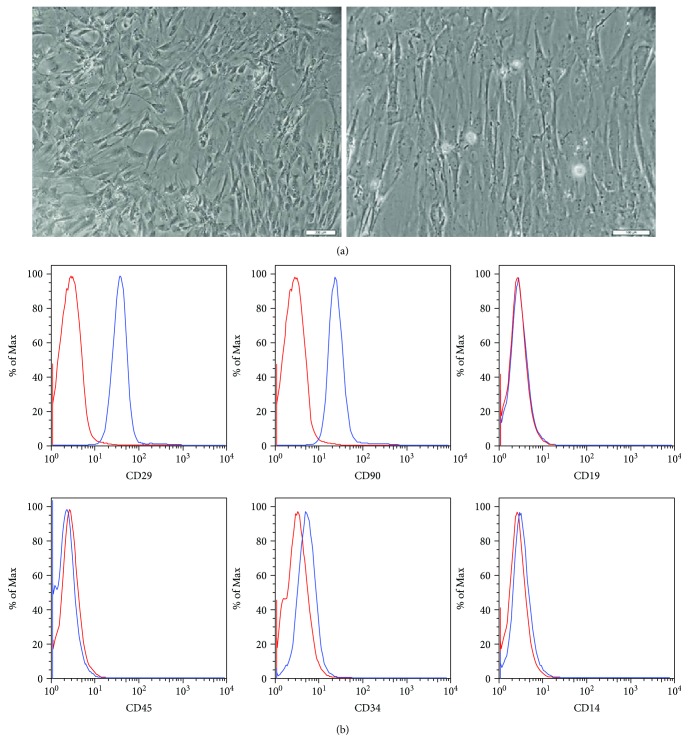
Figure 1.
ADSCs in culture and immunophenotypic characterization. (a) Representative fields showing the fibroblast-like morphology of the ADSCs at passage 3 (magnification 40x, scale bars 200 μm; magnification 200x, scale bars 100 μm). (b) Representative flow cytometry analysis of cell surface markers of ADSCs at passage 3. The isotype control is shown as a red line histogram.

