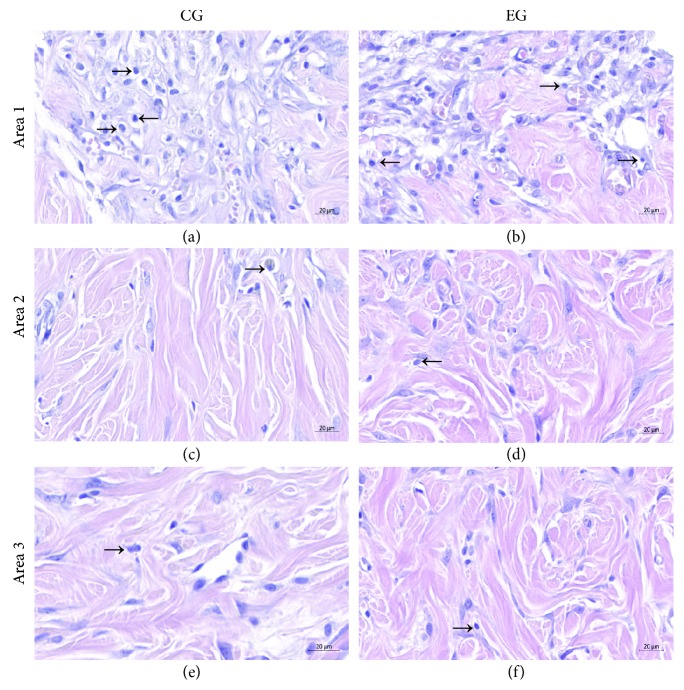
Figure 4.
Inflammatory infiltrate present in the burn region. Inflammatory cells were quantified in the control group (CG: (a, c, e)) and experimental group (EG: (b, d, f)) in three areas: area 1 (border between the epidermis and the first portion of the dermis: (a, b)), area 2 (central region of the dermis: (c, d)), and area 3 (hypodermis: (e, f)). There was no significant difference in the inflammatory infiltrate after the ADSC treatment in the EG compared to the CG in the three areas: area 1 (p = 0.868), area 2 (p = 0.768), and area 3 (p = 0.378).

