Figure 6.
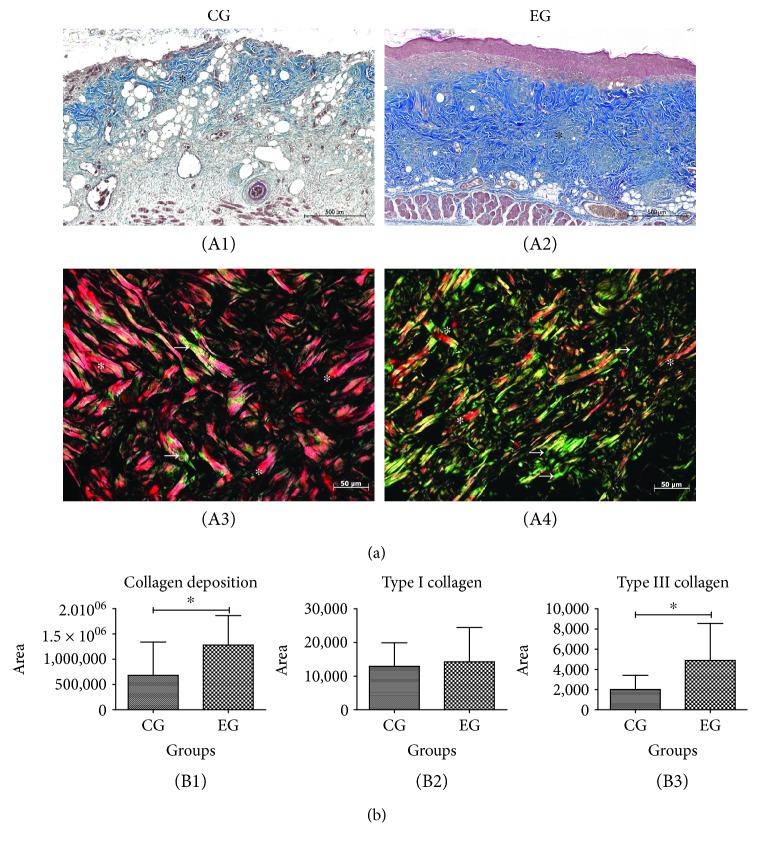
Collagen deposition in the burn region of animals subjected to thermal injury. (a) Representative images on skin cuts stained with Masson trichrome (A1 and A2) and Picrosirius-hematoxylin (A3 and A4). (b) Comparative graph of collagen deposition and type I and type III collagen in the control group (CG) and experimental group (EG). The EG (A2) presented a higher intensity of collagen fibers (∗) than the CG (A1). Magnification 200x; zoom: 10%; scale bars 500 μm. (b) Type I (∗) and III (white arrows) collagen in the burn areas of CG (A3) and EG (A4) stained by Picrosirius-hematoxylin. (B1) Evaluation of collagen deposition per area (p = 0.04). (B2) There was no difference between the groups in the type I collagen (p = 0.73). (B3) There was a significant increase in type III collagen in the EG compared to the CG (p = 0.0338). The results were expressed as the mean ± SD.

