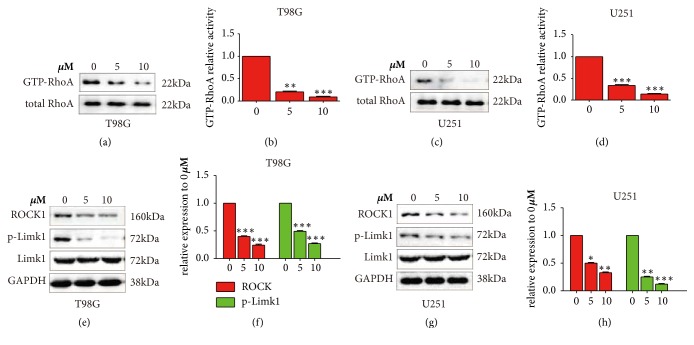
Figure 2.
Paeoniflorin suppressed RhoA/ROCK signaling. (a-d) the GTP-RhoA activity after different dose of paeoniflorin incubation for 24 hours in T98G and U251 cells. (e-h) the protein expression of ROCK1 and p-Limk1 after different concentration of paeoniflorin treatment for 24 hours in T98G and U251 cells. All tests were performed in triplicate and presented as mean ± standard error. ∗∗P<0.01, ∗∗∗P<0.001, compared with control (0 μM).

