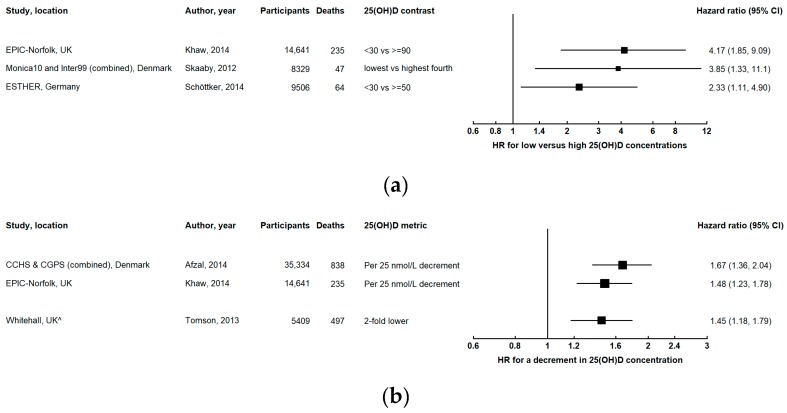
Figure 5.
Results from prospective studies investigating respiratory disease mortality in relation to 25-hydroxyvitamin D (25(OH)D) concentration: (a) comparing low versus high concentrations categorically; (b) continuously, for a decrement in 25(OH)D concentration; (c) low (black) and high (blue) concentrations compared with levels in the middle of the 25(OH)D distribution. The squares represent hazard ratios and horizontal lines are the 95% confidence intervals. ^ Relative risk was estimated in the Whitehall study. Axes are scaled differently in each panel to maximize the visualization of effect estimates.


