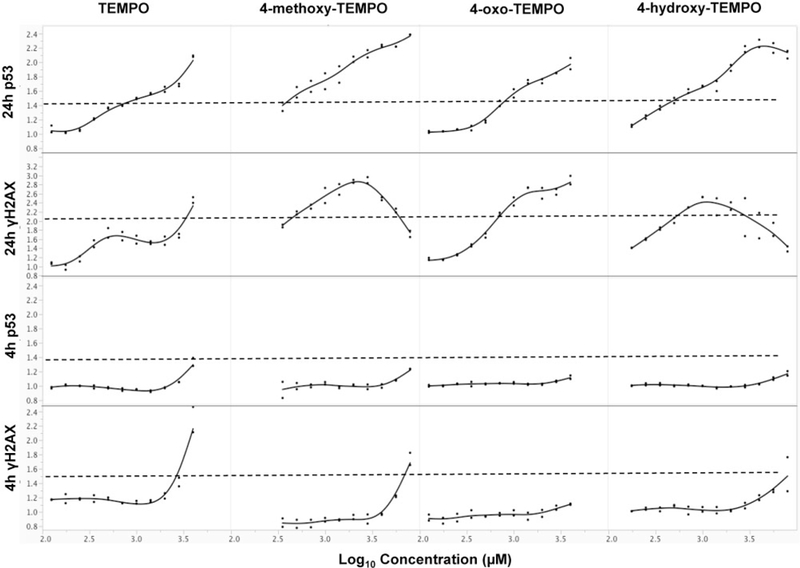
Figure 5.

MoA of TEMPO and its derivatives evaluated by GEF for multiflow DNA damage assay. Data are expressed as fold-increase over concurrent solvent control and plotted for each chemical. Each dot represents a different concentration of the chemical. Dash line represents the GEF for each endpoint.
