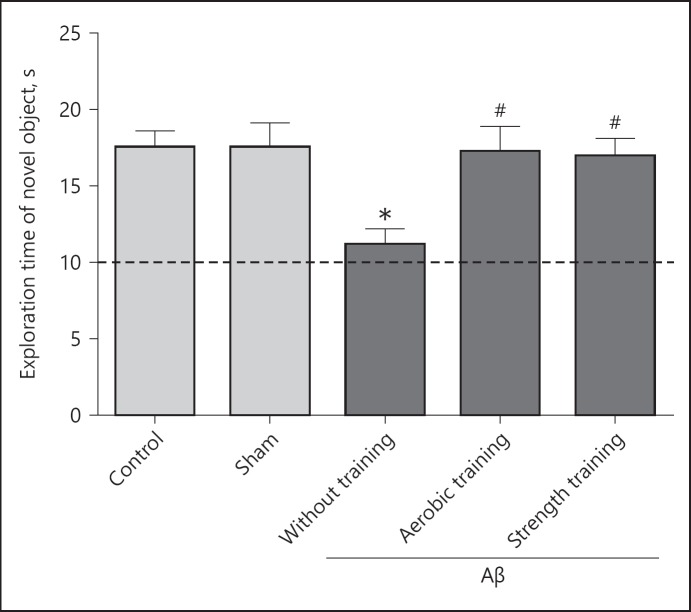
Fig. 1.
Exploration time of the novel object during the test phase of novel object recognition (NOR) task in different groups. Each bar represents the mean ± SEM (n = 10). * p < 0.05 compared to the control group and # p < 0.05 compared to the beta amyloid (Aβ)-received sedentary group respectively. All values were different from the chance exploration (10 s) illustrated by the dashed line (p < 0.05).

