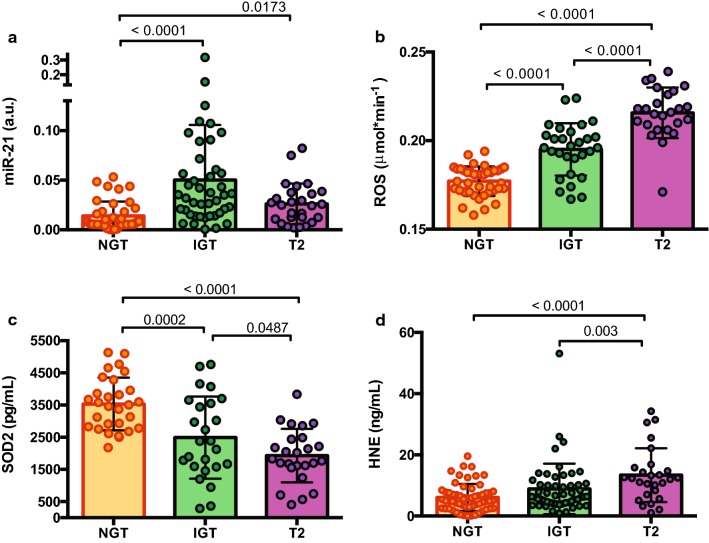
Fig. 1.
Identification of impaired glucose tolerance (IGT) and T2D drug-naïve phenotypes by elevated c-miR-21 expression in plasma samples. a Scatter dot plot of miR-21 expression in IGT and T2D in which miR-21 was normalised to cel-miR-39 expression using the comparative Ct method in a high-risk cohort (N = 109) screened on 2hPG values: NGT, n = 39; IGT, n = 43 and T2D n = 27. Data are presented as the mean (± SD). ANOVA p < 0.0001. b Scatter dot plot of ROS extracellular release (measured by EPR instruments) in sera showing significant increases in IGT and T2D subjects (p < 0.0001 for both), demonstrating the potential role for c-miR-21 in oxidative stress. One-way ANOVA followed by Tukey’s post hoc test. c Plasma concentration SOD2 (pg/mL) in controls (n = 25), IGT (n = 25) and T2 diabetes (n = 24) subjects. d Plasma concentration of HNE (μg/mL) in controls (n = 37), IGT (n = 39) and T2 diabetes subjects (n = 27). Values are mean (± SD) of the concentration of HNE

