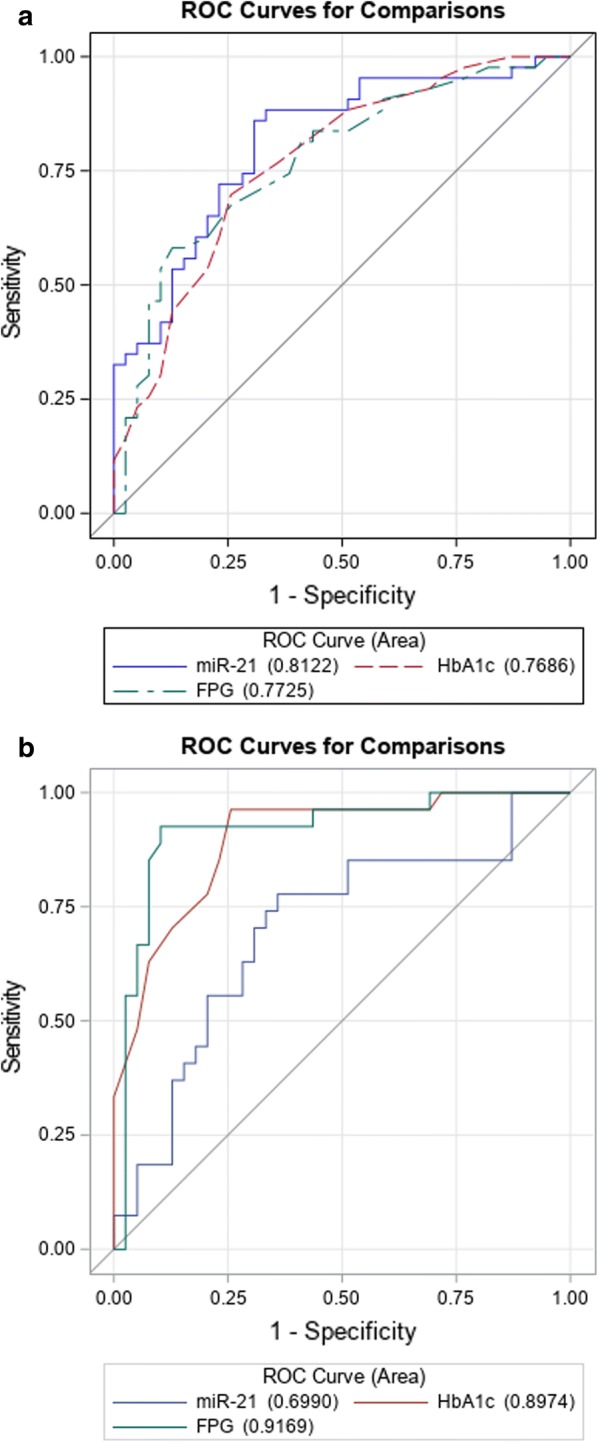
Fig. 3.

Receiver operator characteristic (ROC) curves generated for sensitivity analysis show diagnostic performances among circulating miR-21, FPG and HbA1c in the diagnosis of IGT (a) according to criterion of 2hPG between 140 and 199 mg/dL, and in the diagnosis of T2D (b) according to diabetes criterion of 2hPG ≥ 200 mg/dL. The area under the curves (AUC) is reported as the performance measure
