
Fig. 1.
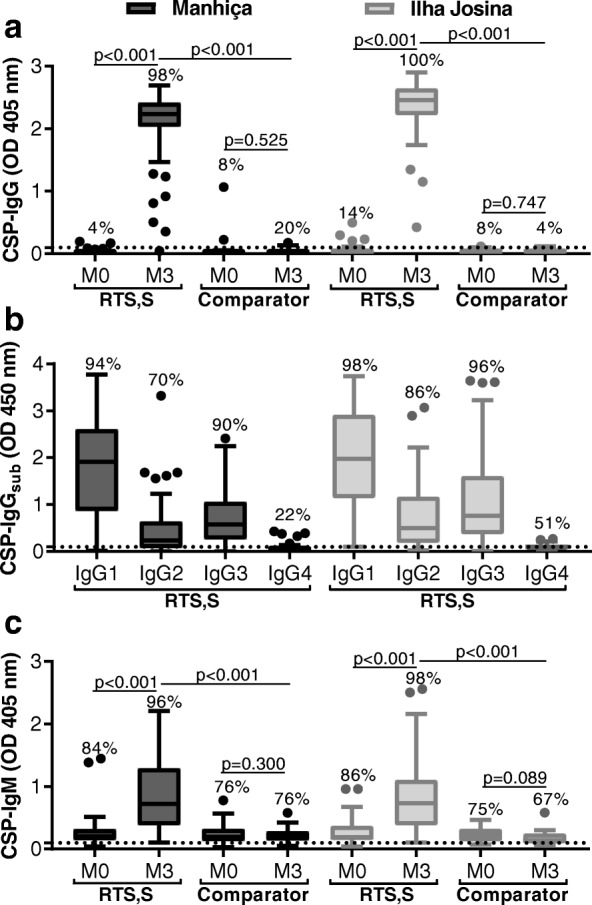
RTS,S vaccine-induced IgG and IgM antibodies to CSP. Children in RTS,S and comparator vaccine groups from Manhiça (black box plots; N = 50 and N = 25, respectively) and Ilha Josina cohorts (gray box plots; N = 49 and N = 24, respectively) were tested for IgG (a), IgG subclasses (b), and IgM (c) to CSP. Sera collected at baseline (month 0, M0) and after vaccination (month 3, M3) were tested in duplicate (note that only M3 was tested in b), and the mean value was used to generate box plots whereby top, center, and bottom horizontal lines represent the 75th percentile, median, and 25th percentile, respectively; upper and lower whiskers represent the highest and lowest values within 1.5× IQR, respectively; and values that exceed this range are presented as dots. Malaria-naïve negative controls from Melbourne donors were used to calculate the seropositivity cutoff value (dashed lines), and the percentage of individuals above this threshold are shown. Reactivity between paired samples and unpaired samples were compared using Wilcoxon matched-pairs signed-rank test and Mann-Whitney U test, respectively