
Fig. 5.
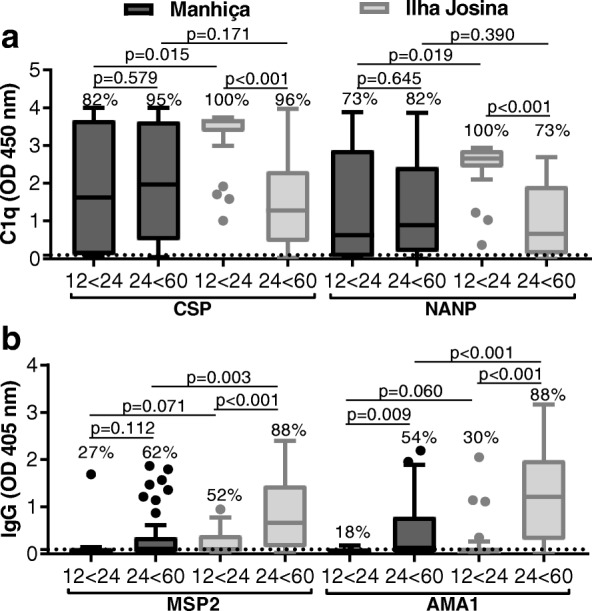
Relationship between age and immunity. Children in RTS,S vaccine group from Manhiça (black box plots) and Ilha Josina cohorts (gray box plots) were categorized into younger (12 to 24 months; Manhiça n = 11 and Ilha Josina n = 23, respectively) and older (24 to 60 months; Manhiça n = 39 and Ilha Josina n = 26, respectively) age groups. Sera collected after vaccination (month 3, M3) were tested for C1q-fixation to CSP and NANP (a) and IgG-reactivity to blood-stage antigens MSP2 and AMA1 (b). Samples were tested in duplicate, and the mean value was used to generate box plots for samples stratified by age group. Top, center, and bottom horizontal lines represent the 75th percentile, median, and 25th percentile, respectively; upper and lower whiskers represent the highest and lowest values within 1.5× IQR, respectively; and values that exceed this range are presented as dots. Malaria-naïve negative controls from Melbourne donors were used to calculate the seropositivity cutoff values (dashed lines), and the percentages of individuals above this threshold are shown. Reactivity between unpaired samples was compared using Mann-Whitney U test