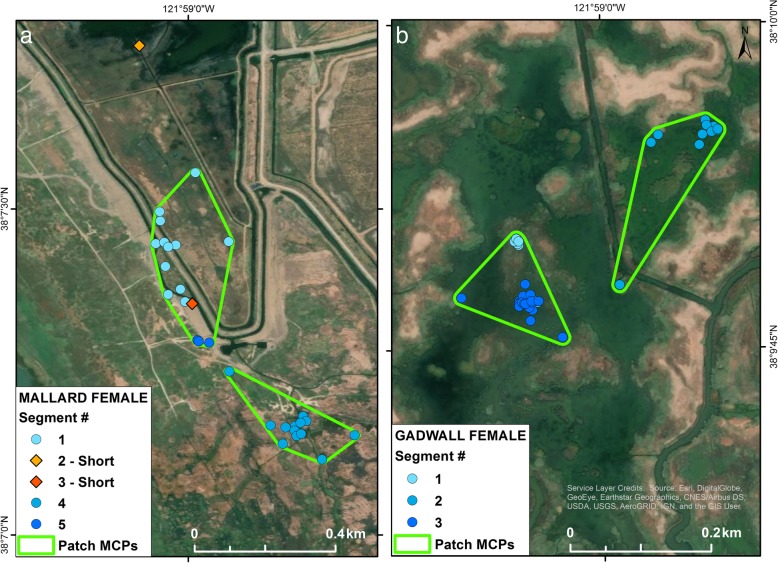
Fig. 2.
Examples of 30 min GPS positions in a single ‘bird day’ for (a) a female mallard and (b) a female gadwall, in Suisun Marsh, California. The figure highlights very short movement distances and areas of use, and combination of multiple patches in close proximity. Positions are colored to represent different track segments that are sections of the daily (24 h) track which consist of all positions within 300m of the starting point of that section. Blue circles indicate long duration segments (≥ 3 locations) and orange and red diamonds indicate locations in short duration segments (1 or 2 locations). Colors vary to indicate different segments. Green outlines show minimum convex polygons (MCPs) that combine > 1 segment into a patch, when the birds returned within 300m of the starting location of a prior segment

