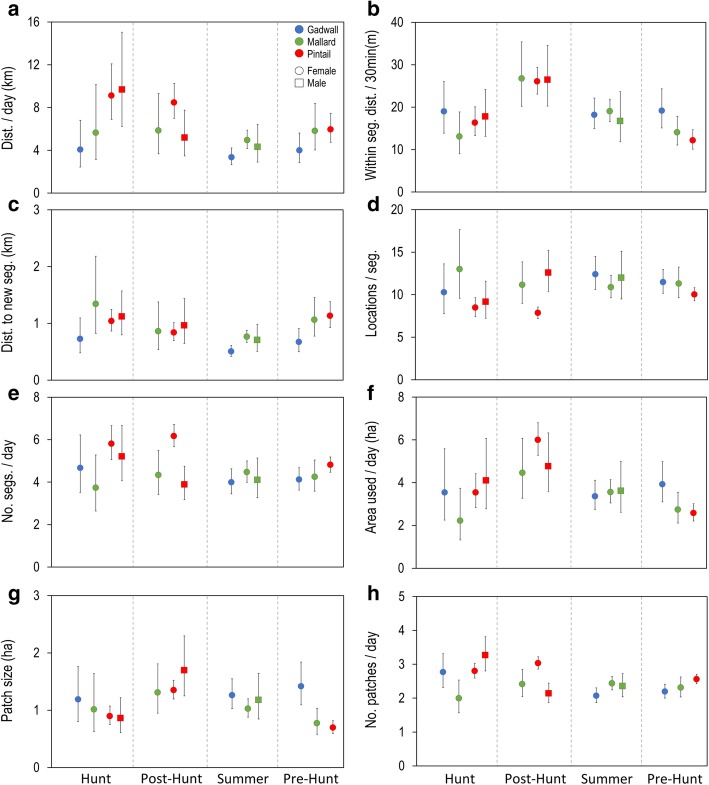
Fig. 3.
Movement data from GPS tracking of gadwall, mallard and pintail of California’s Central Valley separated by season (hunt: Nov-Jan; posthunt: Feb-Apr; summer: May-Aug; pre-hunt: Sep-Oct) and identified for species (gadwall: blue, mallard: green, pintail: red) and sex (female: circle; male: square) groupings: (a) total distance moved per day (24 hr period), (b) distances moved in meters per 30 min (step lengths) within track segments, (c) distances moved in kilometers per 30 min (step lengths) when switching to a new track segment, (d) segment duration (represented by the number of 30 min locations in a track segment; e.g. 10 locations = 5 h), (e) number of track segments per day, (f) total area used per day in hectares, accounting for revisits and overlap of previously used patches, (g) size of individual patches in hectares and, (h) number of patches used per day, accounting for revisits and overlap of previously used patches

