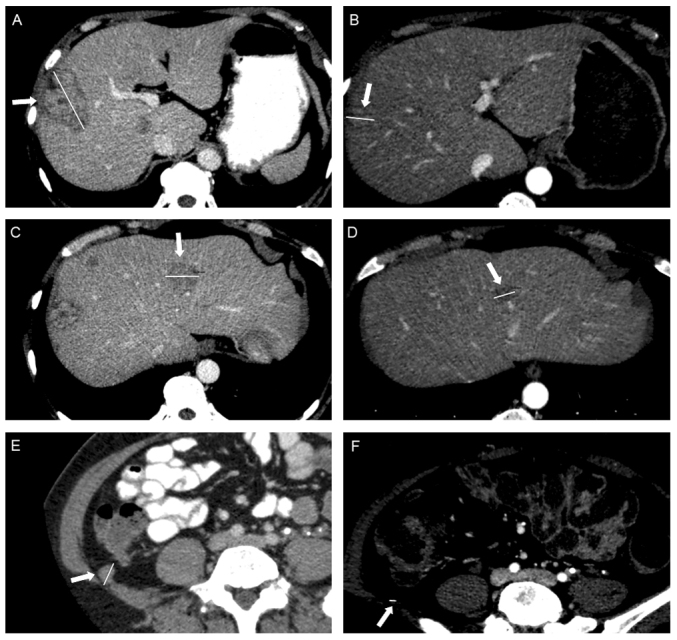
Figure 2.

Computed tomography scans of patient 2 exhibiting a partial response following 11 cycles of Trabectedin: Liver lesion of segment VIII–V at (A) 57 mm vs. (B) 20 mm; liver lesion of segment IVA at (C) 30 mm vs. (D) 16.6 mm; and peritoneal lesion droit (E) 19 mm vs. (F) 5 mm (measurements are indicated by white lines).
