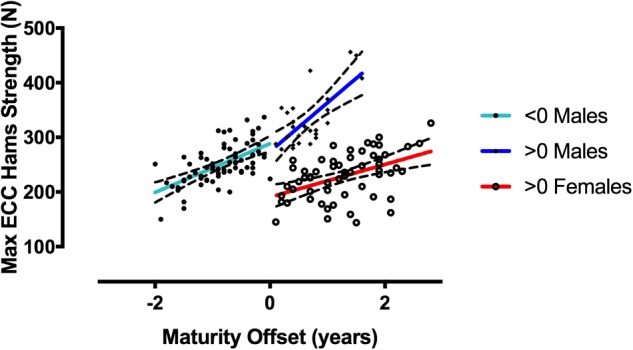
FIGURE 5.

Correlations between MEHS and maturity offset is represented by 0 value. Males < 0: r = 0.59, r2 = 0.35, p < 0.0001; Males > 0: r = 0.70, r2 = 0.49, p < 0.0001; and Females > 0: r = 0.46, r2 = 0.22, p < 0.0001.

Correlations between MEHS and maturity offset is represented by 0 value. Males < 0: r = 0.59, r2 = 0.35, p < 0.0001; Males > 0: r = 0.70, r2 = 0.49, p < 0.0001; and Females > 0: r = 0.46, r2 = 0.22, p < 0.0001.