Fig. 2.
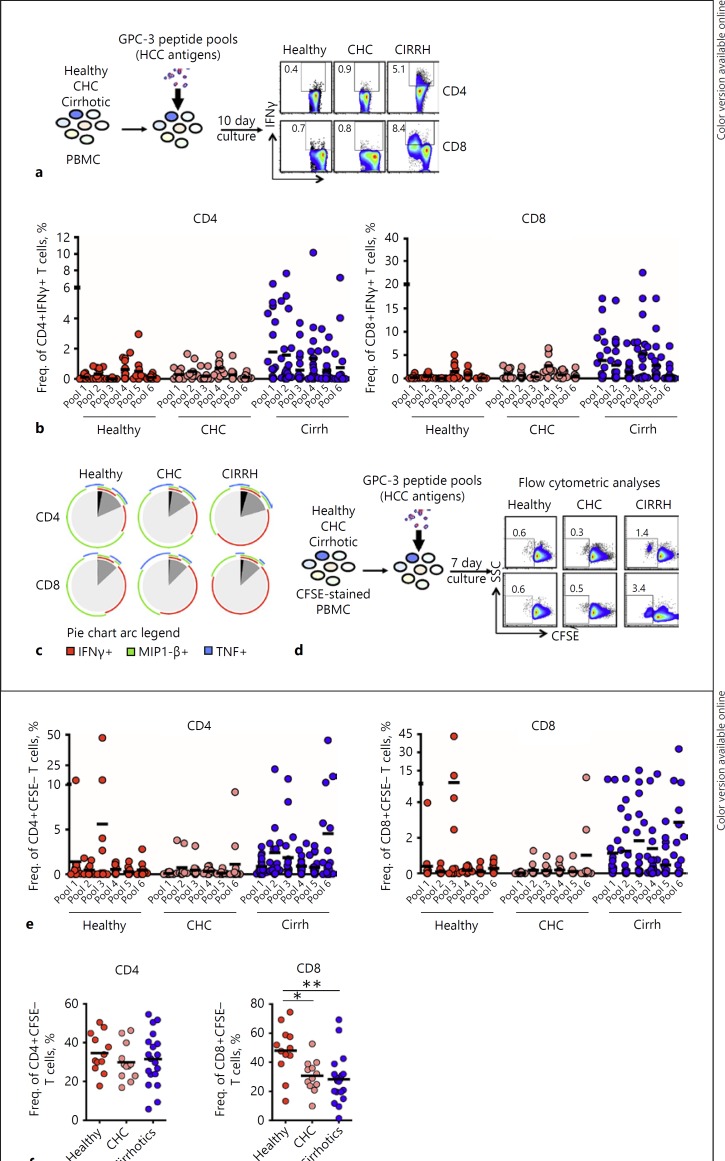
The magnitude and breadth of TAA-specific T cell responses in cirrhosis patients before antiviral therapy for HCV. Detectability of circulating TAA-specific T cell responses to overlapping peptides covering the entire length of GPC-3 were tested in cirrhosis patients and non-cirrhotic controls at baseline in vitro. a Representative FACS plots of IFNγ production compared between cirrhosis patients, non-cirrhotic CHC patients, and healthy individuals are shown. b IFNγ-producing GPC-3-specific CD4+ and CD8+ T cells measured by intracellular cytokine staining upon a 10-day stimulation with HCC-associated peptides. c Boolean analyzed polyfunctional (IFNγ+TNF+MIP1-β+) capabilities of GPC-3-specific CD4+ and CD8+ T cells between cirrhosis patients and the non-cirrhotic controls. Mean values of all subjects in each cohort are represented. d Representative FACS plots showing proliferative responses by GPC-3-specific T cells in the three cohorts as measured by a CFSE proliferation assay in a 7-day culture in vitro.e Proliferation of GPC-3-specific CD4+ and CD8+ T cells in the cirrhosis cohort relative to non-cirrhotic controls. f Proliferative responses of CD4+ and CD8+ T cells to PHA stimulation in cirrhosis patients compared to those by non-cirrhotic controls. Red horizontal bars indicate mean values. All responses for stimulated cultures as plotted were those obtained after deducting background frequencies. Ordinary one-way ANOVA was the statistical test employed. Cirrh, cirrhosis; CHC, chronic hepatitis C; /IFNγ, interferon gamma; MIP1-β, macrophage inflammatory protein 1-β; TNF, tumor necrosis factor.

