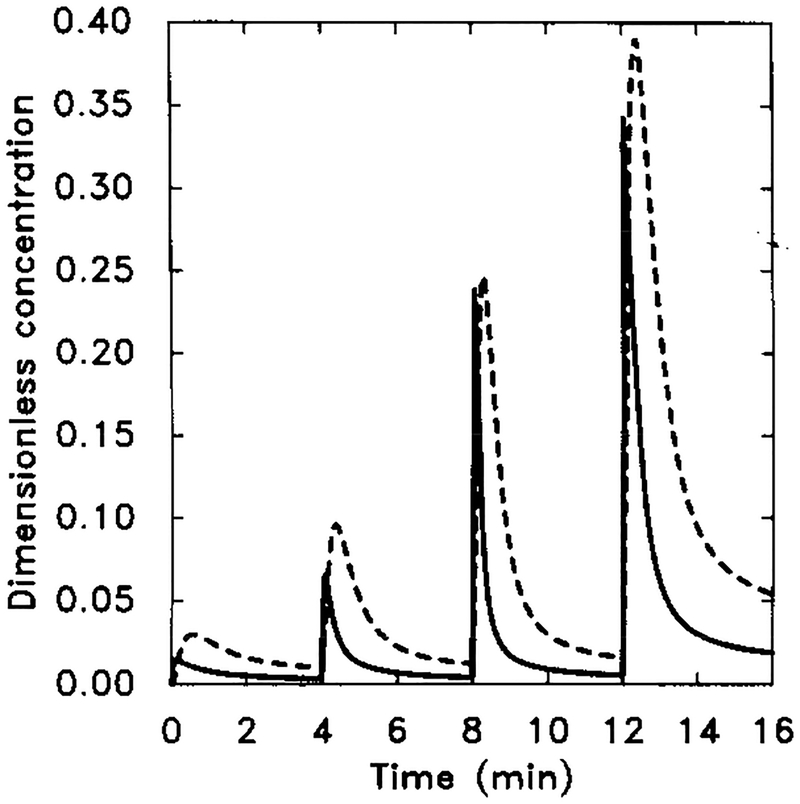
FIG. 10.
The numerical response of the system using the measured k−1. Starting at t = 0 min, extracellular cAMP was increased from 0 to 10−9 M and then to 10−6 M in three 10-fold steps of 4 min duration. Dimensional parameter values are given in Table 4. The dimensionless concentrations of HRs (solid line) and cAMPi/10 (dashed line).

