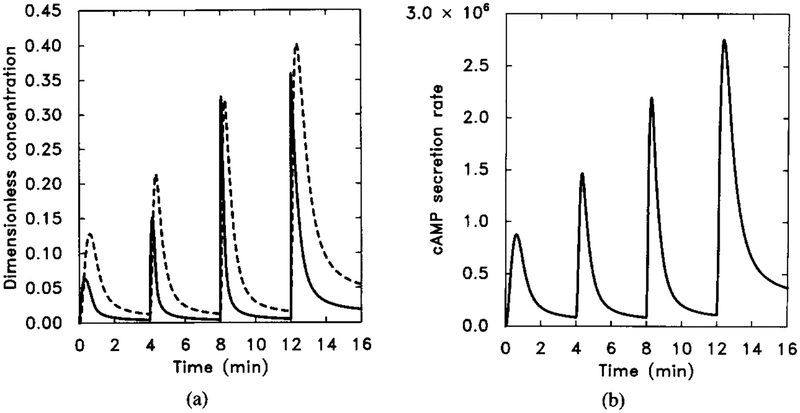
FIG. 11.
The numerical response to sequential 10-fold increases of stimuli with k−1 in Table 4 changed from 0.45 to 0.075. Other parameter values are unchanged. The stimulus is the same as in Figure 10. (a) The dimensionless concentrations of HRs (solid line) and cAMPi/10 (dashed line). (b) The dimensional secretion rate of cAMPi (molecules per cell per minute). Compare with Figure 9 for experimental data.

