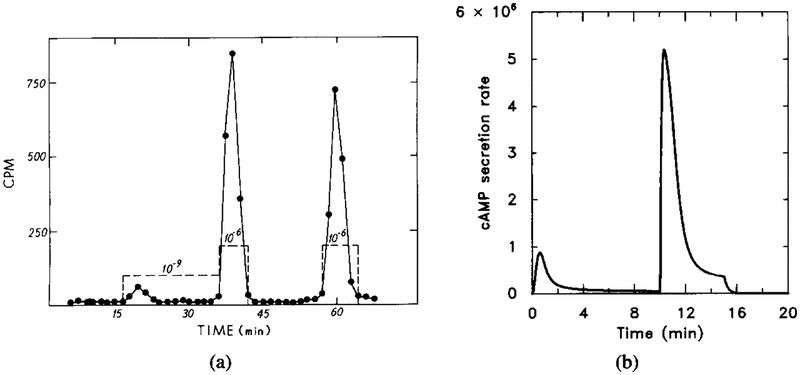
FIG. 12.
The experimental and model response to a two-step sequential stimulus. Note that after removal of the stimulus the unadapted portion decays very rapidly. The parameter value are the same as in Figure 11. The stimulus sequence is [H] = 10−9 M for t = 0 to t = 10, [H] = 10−6 M for t = 10 to t = 15, and [H] = 0 M for t = 15 to t = 20. (a) The experimentally observed response (adapted from [9]). (b) The dimensional secretion rate of cAMPi in molecules per cell per minute.

