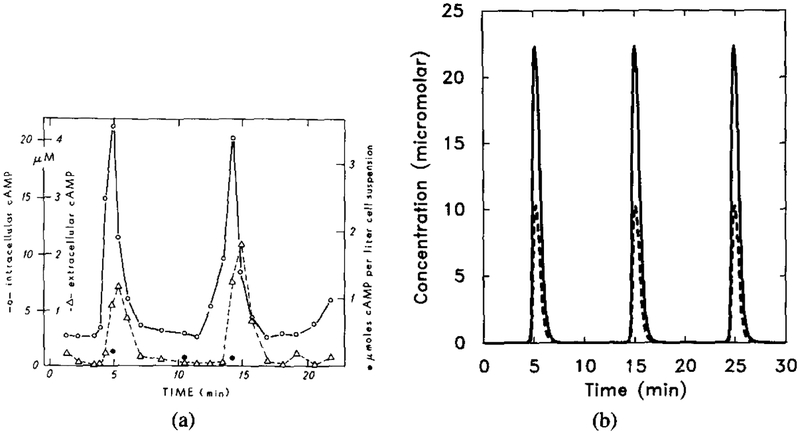
FIG. 15.
The experimental results for oscillations in suspensions and the corresponding numerical results. Parameter values are the same as in Figure 14 except f = 25.0. (a) Experimental measurements of intracellular (◯) and extracellular (Δ). Redrawn from Figure 2 of Gerisch and Wick [20]. (b) Dimensional intracellular cAMP concentration [cAMPi] (solid line) and five times the extracellular cAMP concentration [cAMPo] (dashed line).

