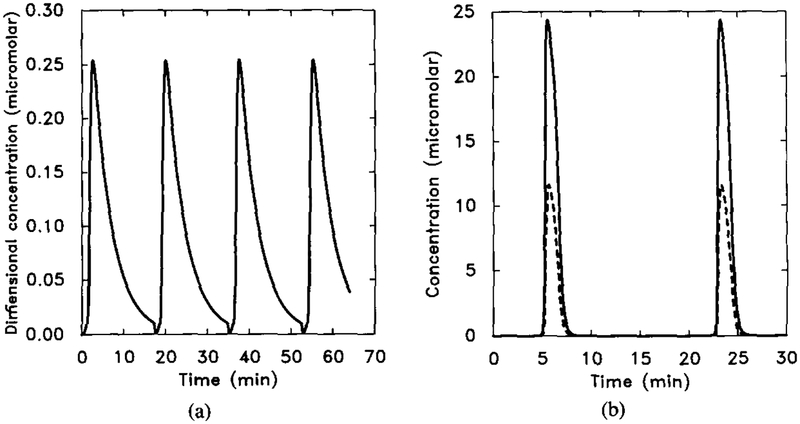
FIG. 17.
An illustration of how changes in β2 and β5 significantly change the oscillation frequency. Here β2 and β5 are divided by a factor of 2. Other parameter values are the same as in Figure 15. Compare with Figure 15. (a) The dimensionless concentration of . (b) Five times the intracellular cAMP concentration [cAMPi] (solid line) and the extracellular cAMP concentration [cAMPo] (dashed line).

