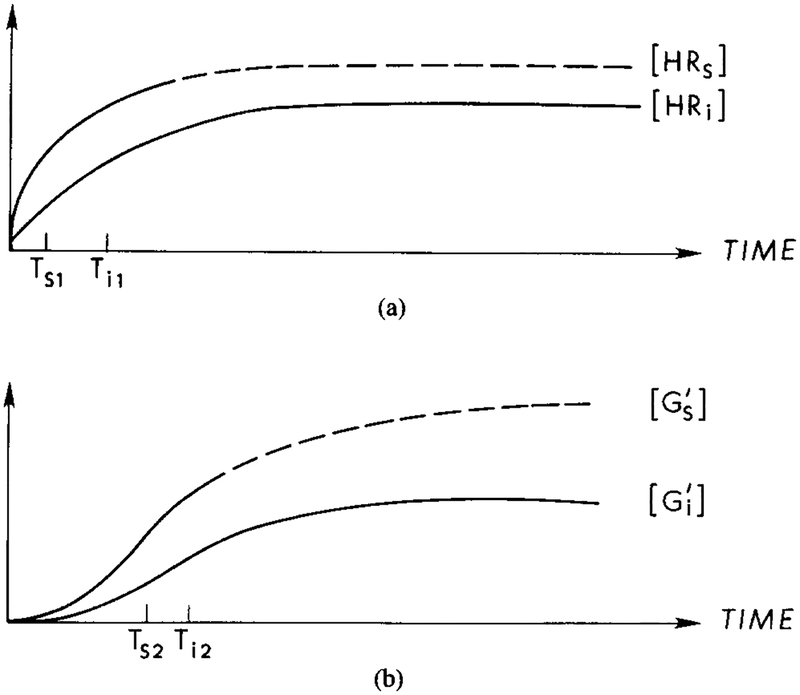
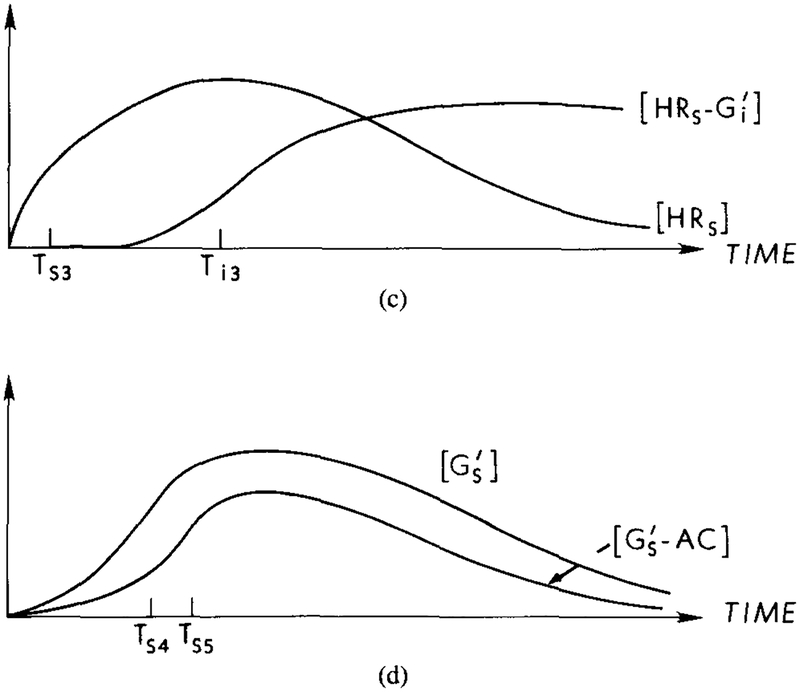
FIG. 4.
A qualitative description of latency and adaptation in the signal transduction process under a constant stimulus. The time for activation of G protein is the major component of the latency between stimulus arrival and activation of the adenylate cyclase. Adaptation at the receptor level results from the interaction of with HRs, which reduces the amount of activated Gs and cyclase. (a) Response curves for HRs and HRi under a constant stimulus. Ts1 and Ti1, represent the half-maximal times for the respective components. The dashed line indicates the response for HRs in the absence of an inhibitory effect. (b) Response curves for the concentrations of and . Ts2 and Ti2 represent the half-maximal times for the respective components. The dashed line indicates the response if the inhibitory effect is not present. (c) In the presence of , HRs is diminished due to the formation of . The half-maximal time, Ts3, for HRs in the presence of is approximately the same as Ts1, whereas Ti3 > Ti2. (d) Response curves for the concentration of and . The half-maximal time for , Ts4, is approximately equal to Ts2, whereas the half-maximal time for , Ts5, is greater than Ts4. The rate of cAMPi production is proportional to the concentration of GsAC.


