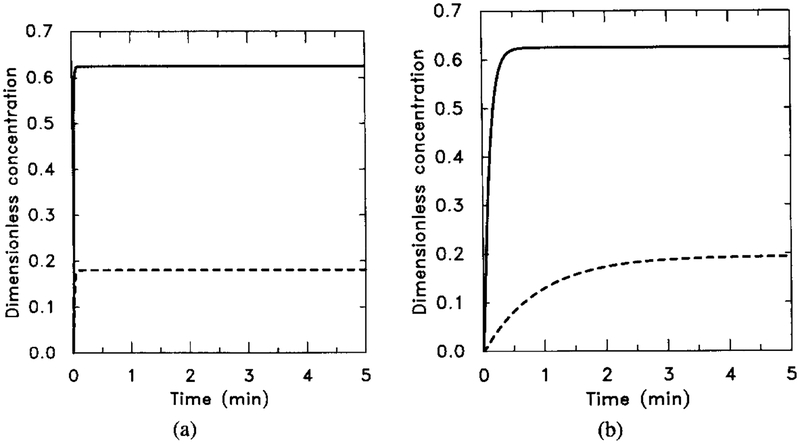
FIG. 5.
The response of the uncoupled system. The stimulus is [H] = 0.1 μM for t ∈ (0, 5). The numerical results can be compared with the analytical results obtained from the analysis in Section 4 and with Figure 6 to verify the steady-state additivity of the uncoupled system. (a) The dimensionless concentrations of HRs (solid line) and HRi (dashed line). (b) The dimensionless concentrations of (solid line) and (dashed line). Note that the half-time for the buildup of agrees well with the theoretical estimate but that the rise time for is longer than the theoretical estimate. This discrepancy indicates that the pseudo-steady-state hypothesis applied to [HRsGs] is probably not valid on this time scale.

