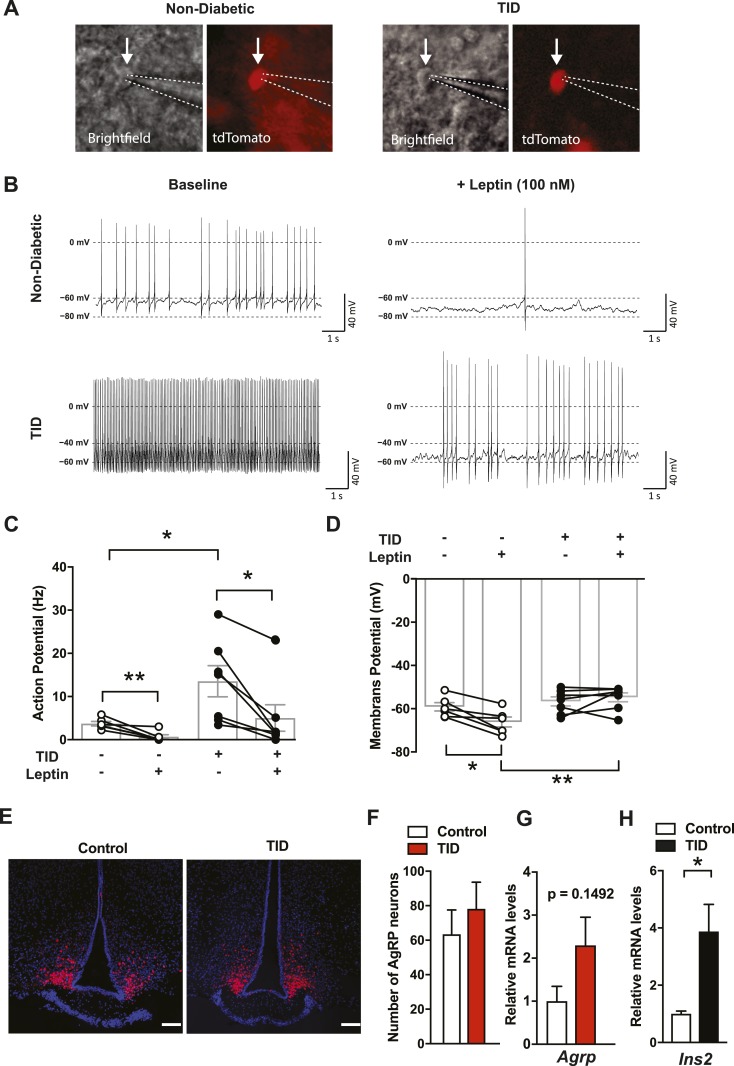
Figure 5.
Total insulin deficiency hampers leptin’s action on AgRP neuronal activities. (A) Brightfield and tdTomato fluorescent images of the targeted AgRP neurons in nondiabetic (left) and total insulin-deficient (TID) mice. Arrows indicate the targeted cells; dotted lines show the tip of the patch pipette. (B) Representative traces showing that baseline discharge (left) of an AgRP neuron from a mouse with T1D (bottom) and a nondiabetic control (top). Bath-applied leptin (right) normalized discharge frequency between groups by reducing firing rate more in the neurons from a T1D rather than a nondiabetic mouse. (C) Action potential discharge frequency (Hz) and (D) membrane potential (mV) among AgRP neurons from TID and nondiabetic mice with and without leptin. (E) Representative images (red, tdTomato fluorescent; blue, 4′,6-diamidino-2-phenylindole DNA staining) and (F) the number of AgRP neurons in Agrp-IRES-Cre∷RIP-DTR∷Ai9TB/− mice 10 days after induction of total insulin deficiency. DT was injected three times (days 0, 1, and 2). Control group was injected with sterile saline. Scale bars, 100 µm. (G) mRNA levels of Agrp in the hypothalamus of RIP-DTR mice 2 days after a single DT injection. (H) mRNA levels of Ins2 in the hypothalamus of RIP-DTR 10 days after induction of total insulin deficiency. Of note, our previous study demonstrated that 48 hours after a single DT injection, mRNA levels of preproinsulin in the pancreas were dramatically reduced (2). n = 4 to 6. Values are mean ± SEM. **P < 0.01; *P < 0.05.

