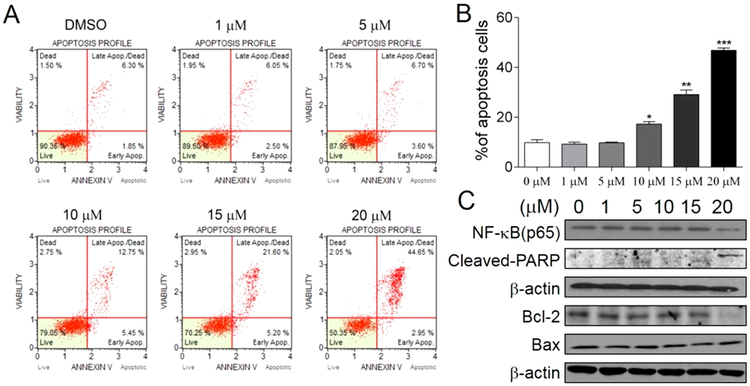
Figure 7.
Induction of apoptosis in MDA-MB-231 breast cancer cells by 44. (A) Flow-cytometry analysis of apoptotic MDA-MB-231 breast cancer cells induced by 44 at different concentrations. (B) Apoptotic ratio of different concentrations of 44 in MDA-MB-231 breast cancer cells. The values are means ± SD of at least three independent experiments. A single asterisk represents p < 0.05, two asterisks represent p < 0.01, and three asterisks represent p < 0.001 to 0 μM group (DMSO, vehicle control). (C) Western-blot analysis of biomarkers for apoptosis induced by 44 in MDA-MB-231 breast cancer cells at different concentrations (48 h).

