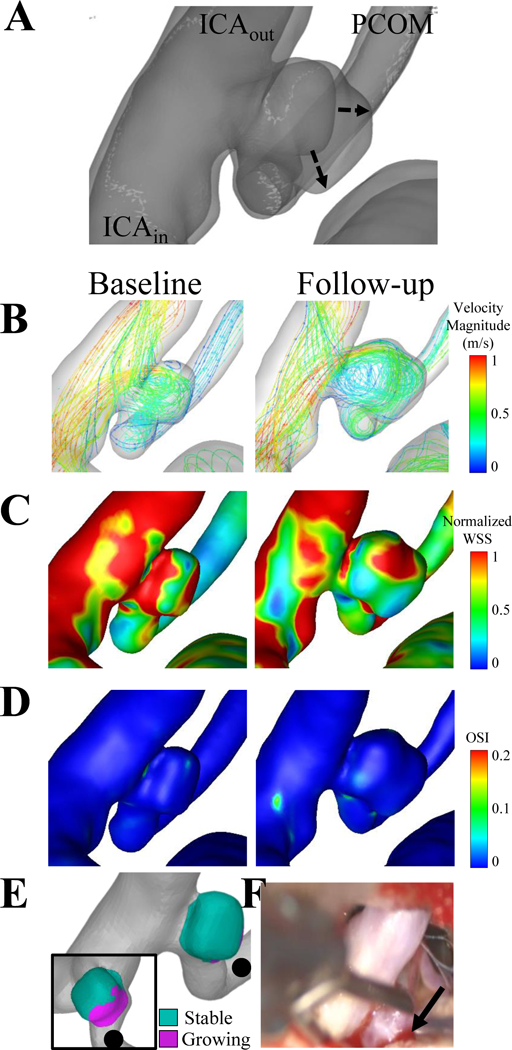
Figure 3. Case 3, a left posterior communicating artery aneurysm.

(A) The dashed lines of the co-registered images indicate that the growth from the baseline to the follow-up times was non-uniform. The flow inlet (ICAin) and two flow outlets (ICAout and PCOM) are indicated on the co-registered images. (B) Velocity streamlines, (C) wall shear stress and (D) oscillatory shear index are shown for the baseline and follow-up time points. (E) Two views are given to show the growing and stable regions, where the black dot indicates the posterior communicating artery. (F) The solid arrow on the intraoperative image shows the red region of the partially obstructed aneurysm sac.
