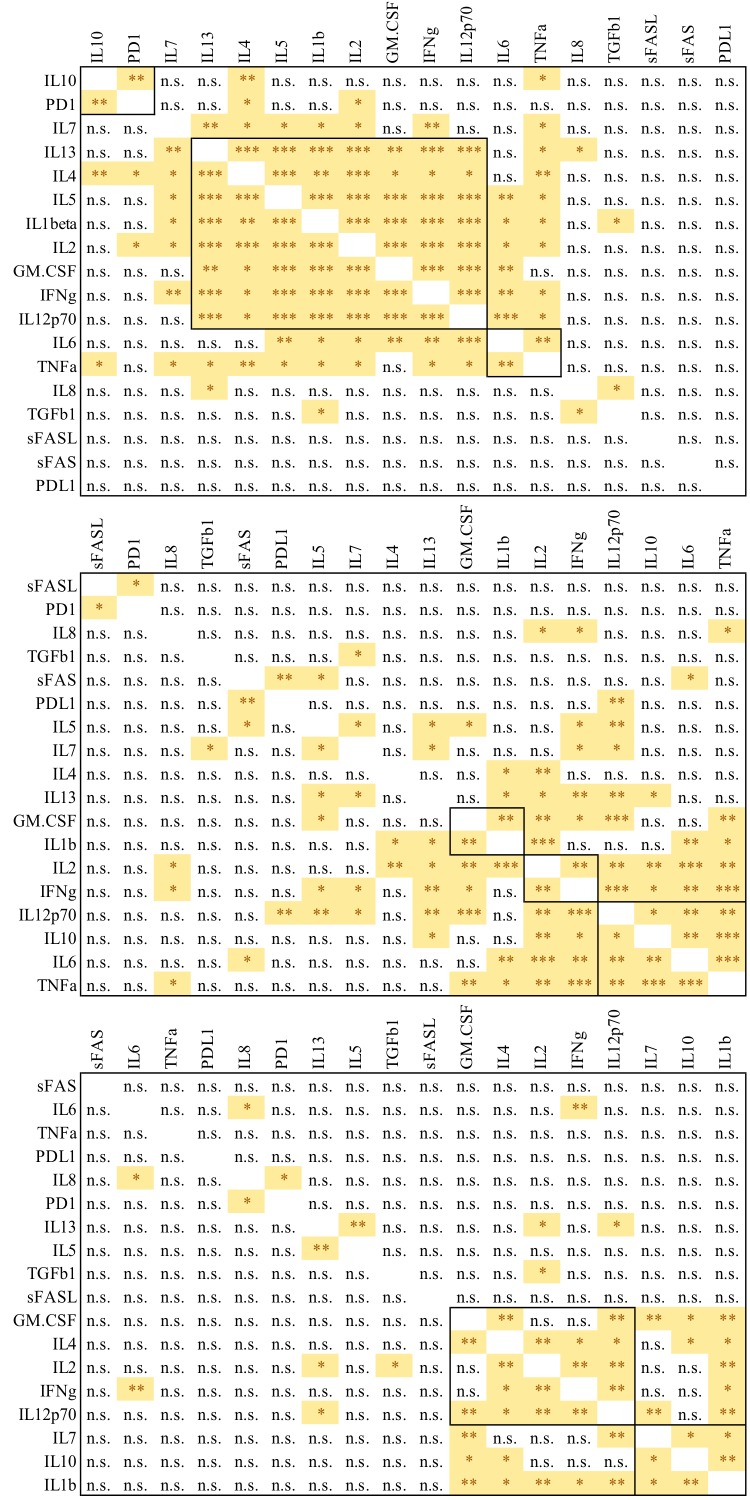
Supplementary Figure 1.
P Values for Figure 2. Correlation coefficients P values for biomarker levels are shown for (A) healthy controls, (B) HBV-monoinfected patients and (C) HBV/HIV-coinfected patients, P value<0.05 (*), <0.01(**), <0.001(***), >0.05(n.s.)

