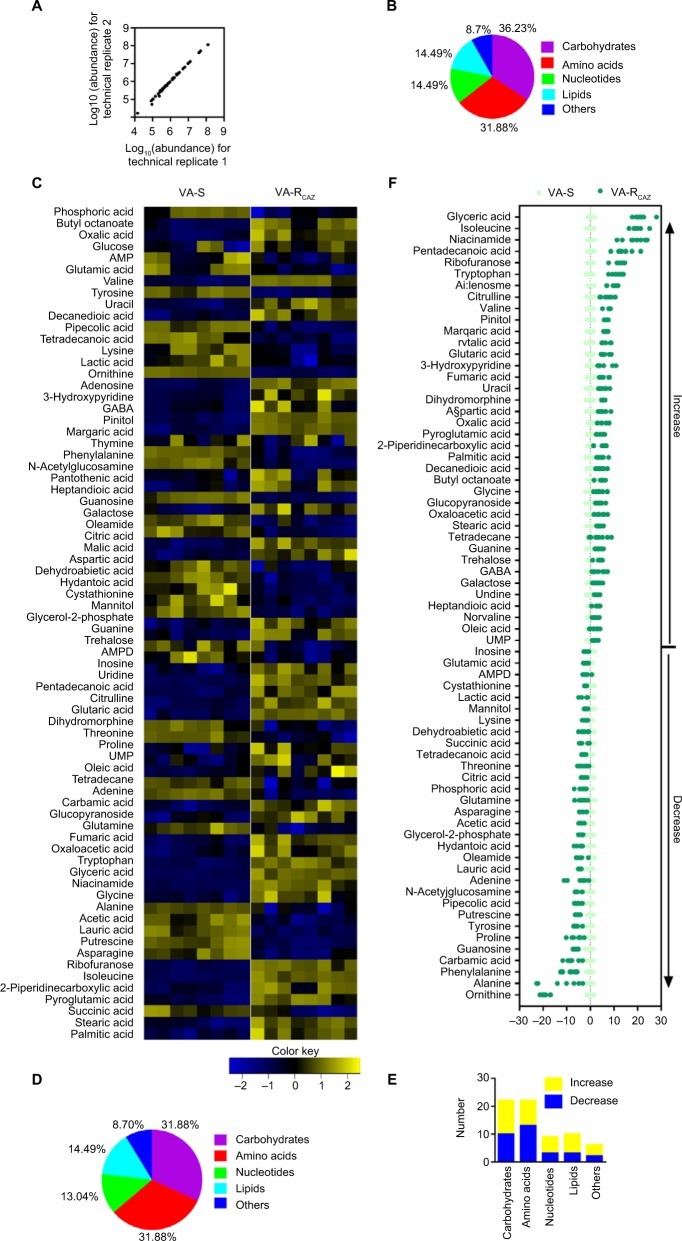
Figure 2.
Metabolic profiles of VA-S and VA-RCAZ.
Notes: (A) Abundance of metabolites quantified in samples over two technical replicates is shown. Pearson correlation coefficient between technical replicates varies between 0.997 and 1.0. (B) Percentage of metabolites in every category. (C) Heat map of differential abundance of metabolites (row). Yellow and blue indicate increase and decrease of the metabolites scaled to mean and SD of row metabolite level, respectively (see color scale). Four biologic replicates in each group and two technical repeats for each biologic replicate were performed, yielding a total of 16 data sets. (D) Percentage of differential abundant metabolites in every category. (E) Number of differential abundant metabolites increased and decreased in every category. (F) Z-score plots corresponding to the data in panel (A). The data from VA-RCAZ are separately scaled to the mean and SD of VA-S. Each point represents one metabolite in one technical repeat and is colored by sample types (yellow: VA-S, blue: VA-RCAZ).
Abbreviations: VA-RCAZ, ceftazidime-resistant Vibrio alginolyticus; VA-S, ceftazidime-sensitive Vibrio alginolyticus.

