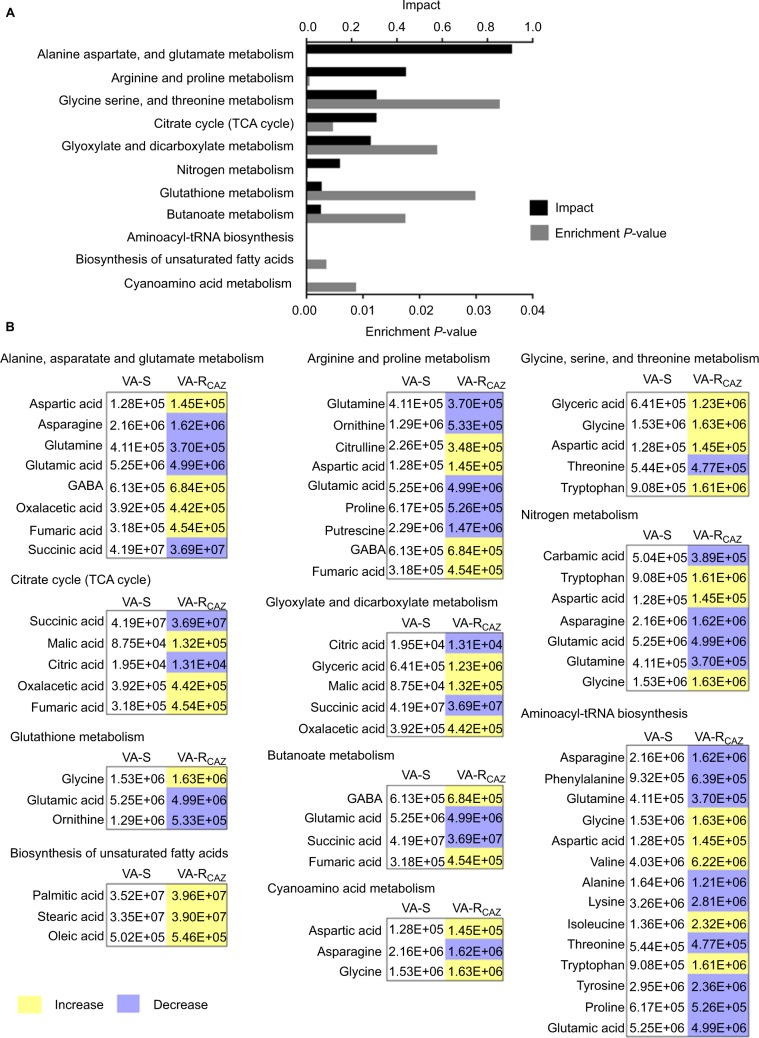
Figure 3.
Pathway analysis.
Notes: (A) Pathway enrichment of differential abundant metabolites. (B) Integrative analysis of differential abundant metabolites in significantly enriched pathways. Yellow and blue indicate increase and decrease of metabolites, respectively. Number shows the differential abundant metabolites.
Abbreviations: VA-RCAZ, ceftazidime-resistant Vibrio alginolyticus; VA-S, ceftazidime-sensitive Vibrio alginolyticus.

