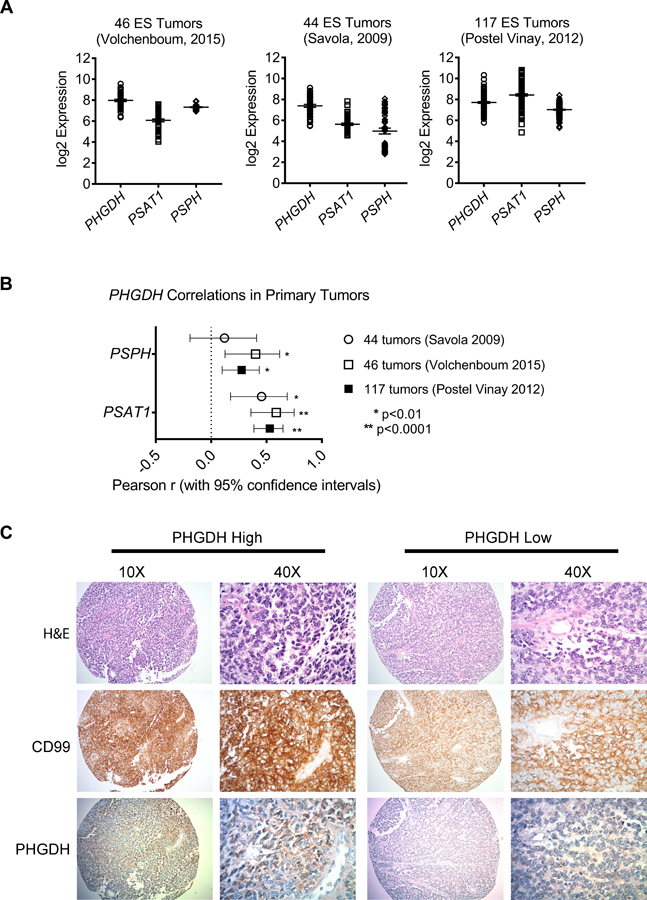
Figure 2.

SSP expression in Ewing sarcoma primary tumors. (A, B) Data from three publicly available gene expression profiling datasets of Ewing sarcoma tumors, showing transcript expression of SSP enzymes (A) and the correlations between PHGDH and PSAT1 or PSPH (B). (C) Representative images depicting high and low immunohistochemical staining for PHGDH in a cohort of Ewing sarcoma tumors. Hematoxylin and eosin (H&E) and CD99 staining were performed in adjacent sections.
