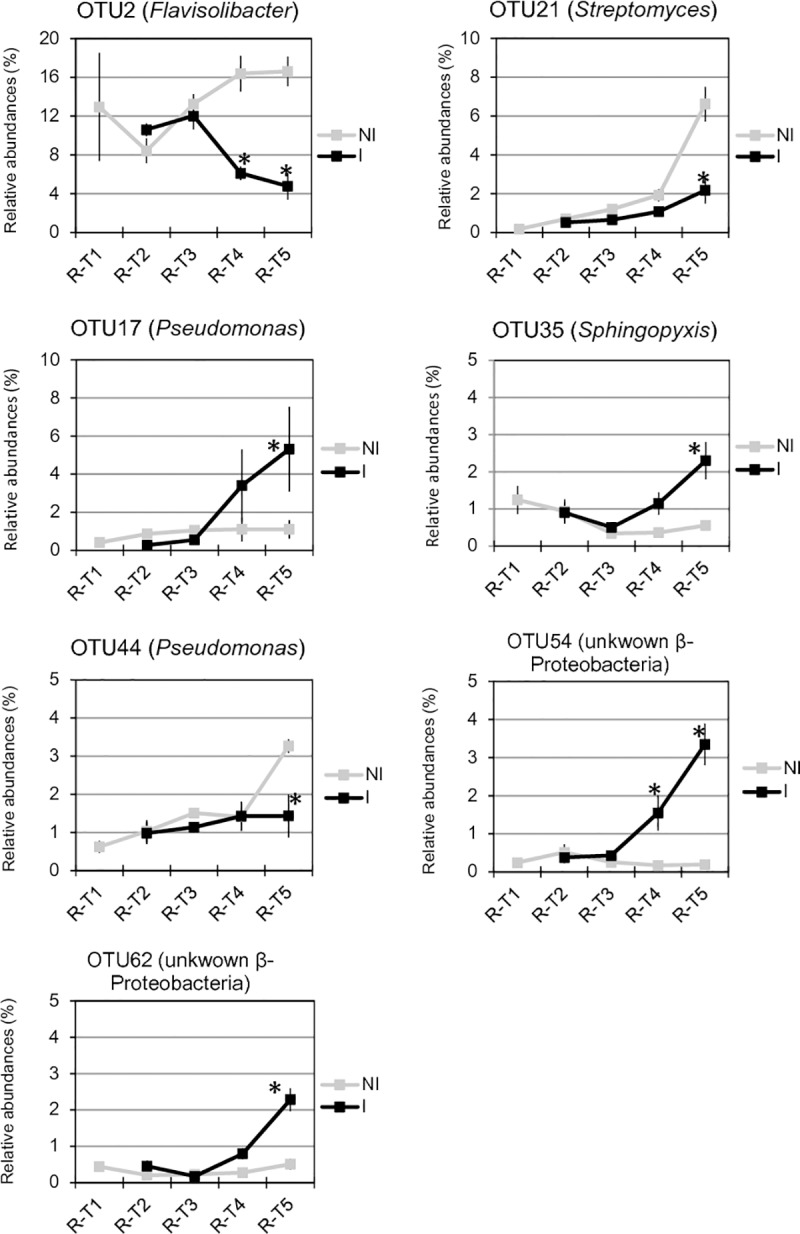
Fig 8. Temporal dynamics of bacterial OTU relative abundances in the root microbiota of non-inoculated (NI) and inoculated (I) plants.

Relative abundances (expressed in %) of the most abundant OTUs in root (R) at each date of sampling are represented. Date of sampling refers to 0 (T1), 7 (T2), 14 (T3), 23 (T4) and 35 (T5) days after inoculation (DAI) with P. brassicae. Each dot represents the mean value of relative abundance (± SEM) of three replicates. Stars indicate significant differences (p-values ≤ 0.05) between inoculated (I) and non-inoculated (NI) plants (represented by black and grey lines, respectively) at each sampling date.
