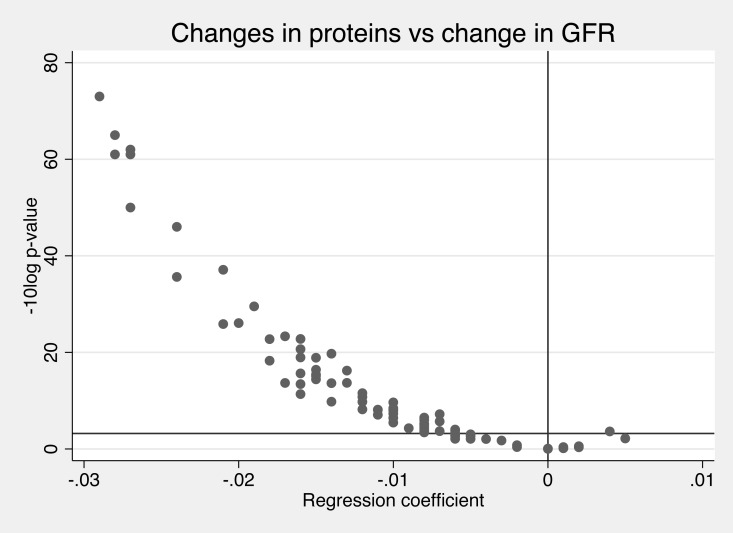
Fig 3. Associations between the change in kidney function (glomerular filtration rate, GFR) and change in 84 prteins over time (regression coefficient) and the–log10 p-value for these associations.
The Bonferroni-corrected p-value is shown as the horizontal line. The regression coefficient (beta) gives the relationship between the change in protein levels (on a SD-scale) vs the change in GFR (in mL/min/1.73m2).

