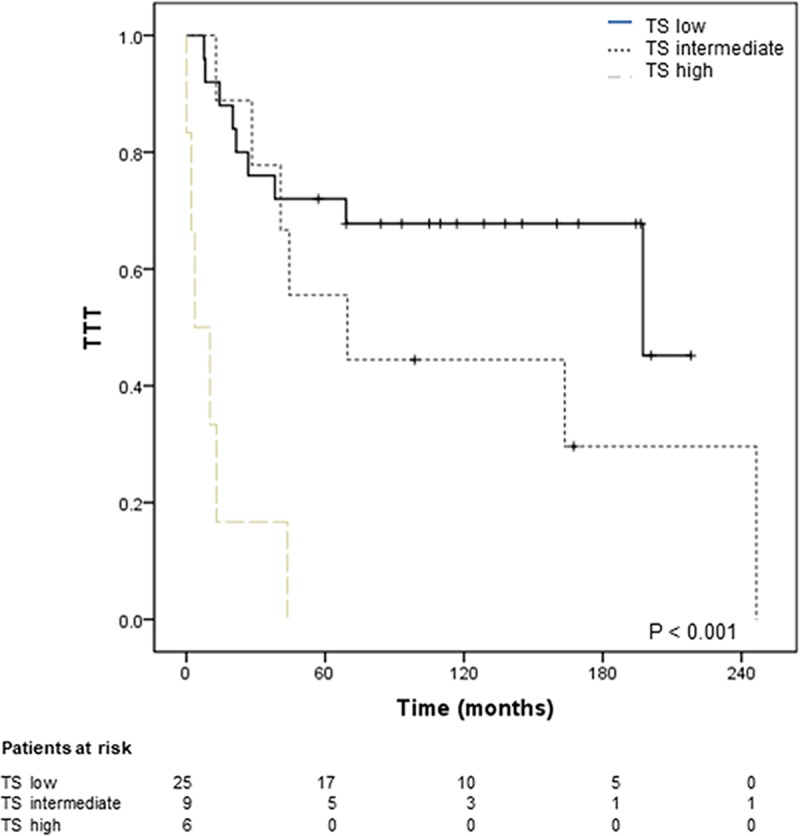
Fig 3. Estimates of time to transformation of patients classified by transformation risk score.

Time to transformation (TTT) according to the score groups calculated for each patient based on the sum of individual points of each mutated gene significantly associated with transformation in the Cox regression analysis (Table 3) and included in the final model. Forty patients were included in the analysis: 22 suffered histological transformation and 18 did not transform. After 5 years (60 months) 100% of high-risk, 55% of intermediate-risk, and 32% of low-risk patients had transformed. The log-rank p value is shown. TS: transformation risk score.
