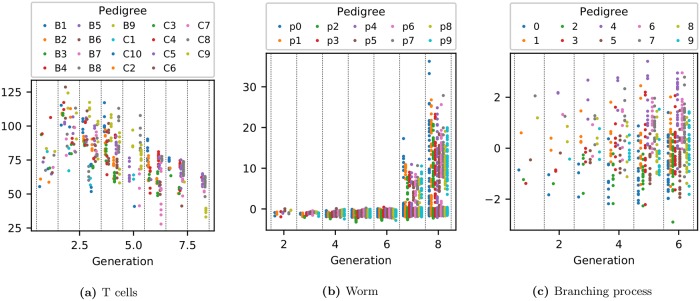
Fig 2. Expression of each phenotype as a function of generation.
The vertical axis represents the strength of expression for each measured phenotype. For T cells this is the lifetime-averaged cell area in μm2; for C. elegans it is the lifetime-averaged intensity of green fluorescent protein used to tag PHA-4 expression.

