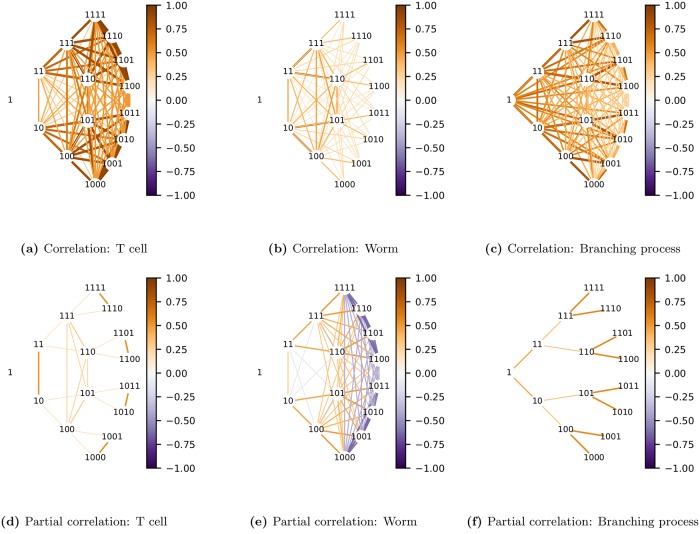
Fig 9. Lineage correlation maps.
These are undirected graphs in the original variables (shown as binary numbers). Each generation is arranged in an arc centered on the root node. The color of edges in each graph corresponds to the correlation (top row) or partial correlation (bottom row) between pairs of lineal positions. To avoid clutter, only the first 4 generations are shown. Note how the graph (f) of partial correlations for the simulated branching process, where daughters are conditionally uncorrelated, is a binary tree. This is not the case for the real lineages.

