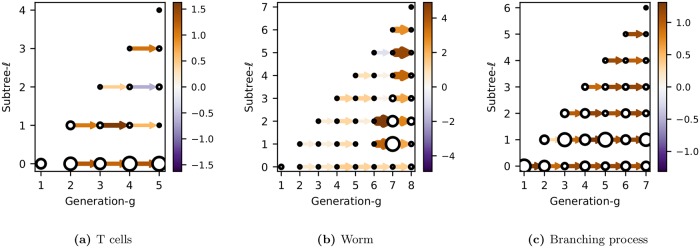
Fig 10. Dynamic lineage maps.
These directed graphs in the natural variables show the dynamics of the bifurcated expression pattern in each subtree ℓ. The color (and thickness) of an edge between node j and j′ corresponds to the transmission strength, βℓjj′. The size of the node corresponds to the innovation strength, .

