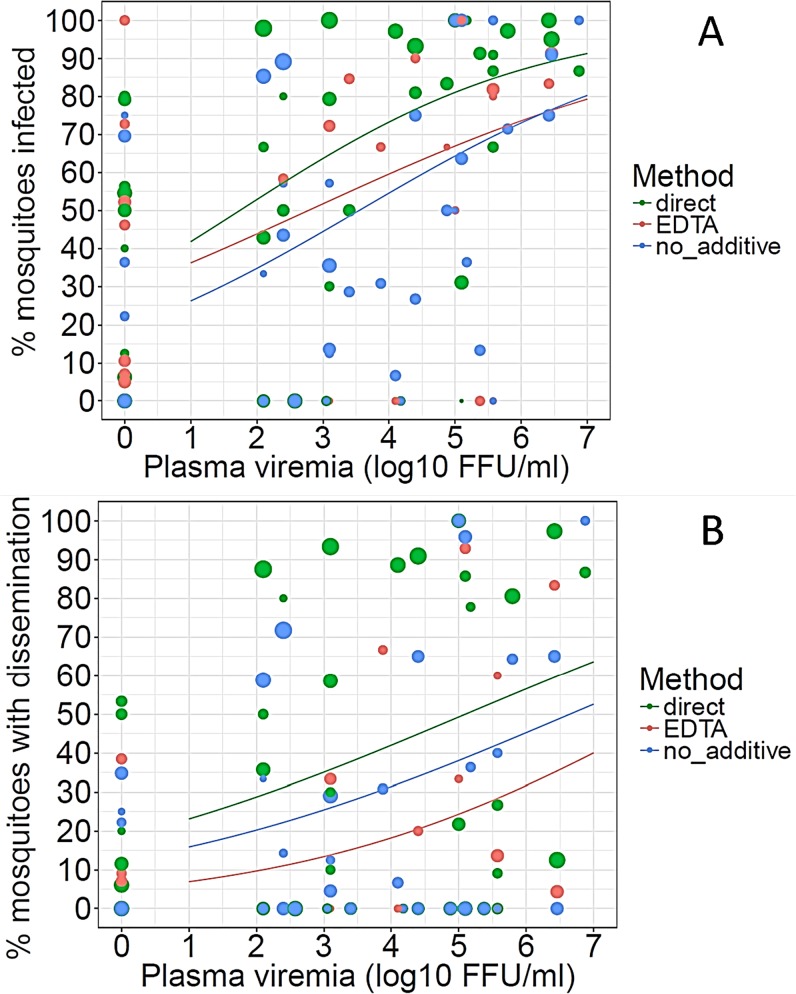
Fig 3.
Dose-response curve of DENV infection in mosquitoes (A) and DENV dissemination in infected mosquitoes (B). The percentage of infected mosquitoes is shown as a function of viremia expressed in focus-forming units (FFU)/mL of serum for each study participant. Red, green, and blue symbols represent direct feeding, indirect feeding on blood with EDTA, and indirect feeding on blood without additive, respectively. The size of each dot is proportional to the number of mosquitoes tested per participant. Curves are logistic regressions of the data, excluding data for participants with undetectable viremias.

