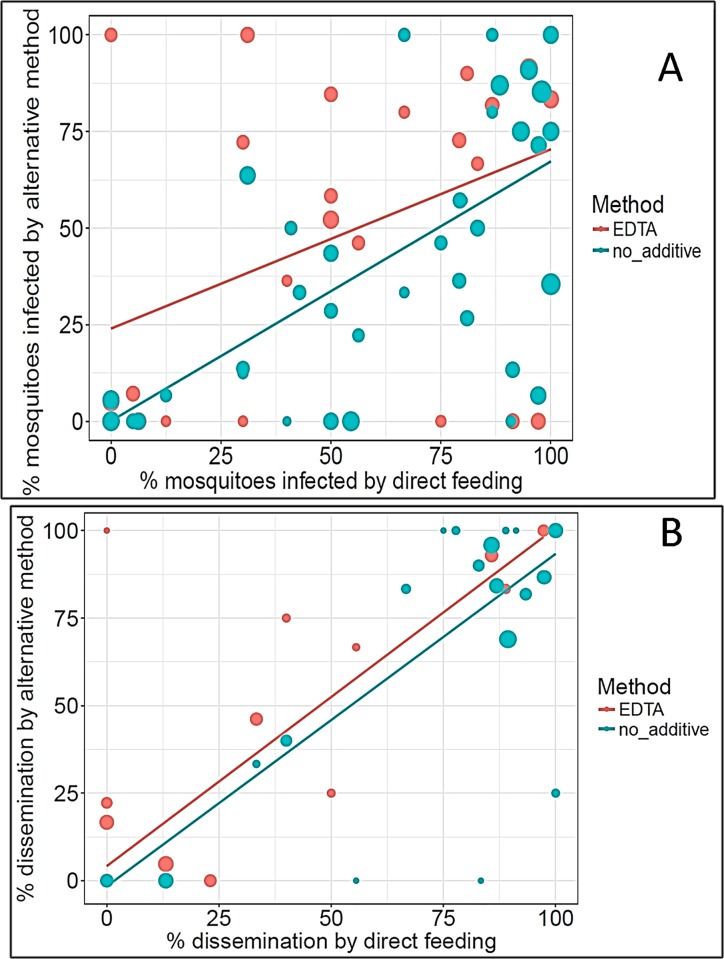
Fig 4.
Correlations in the percentages of mosquitoes showing DENV infection (A) and dissemination (B) following direct and indirect feeding. Each dot represents the percentage of mosquitoes infected with DENV by direct feeding versus an indirect feeding on the same study participant. Blue dots represent direct feeding versus indirect feeding on blood without additive (infection: R2 = 0.48, p < 0.0001; dissemination: R2 = 0.83, p < 0.0001). Red dots represent direct feeding versus indirect feeding on blood with EDTA (infection: R2 = 0.16, p = 0.0195; dissemination: R2 = 0.85, p < 0.0001). The size of each dot is proportional to the total number of mosquitoes tested following feeding by the paired methods. The lines represent weighted linear regressions.

