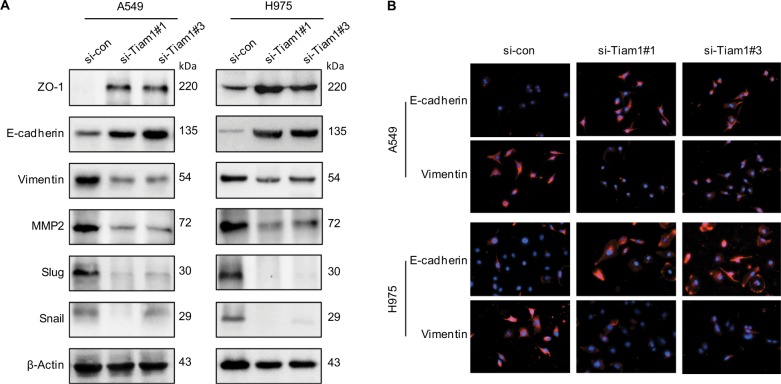
Figure 5.
Correlation between Tiam1 overexpression and cancer cell EMT progression.
Notes: (A) Relative expression levels of EMT markers in A549 and H1975 cancer cells with si-control or si-Tiam1, respectively. (B) IF staining for EMT markers in A549 and H1975 cancer cells, where cells were transfected with si-control and si-Tiam1 (400×).
Abbreviations: EMT, epithelial–mesenchymal transition; IF, immunofluorescence.

