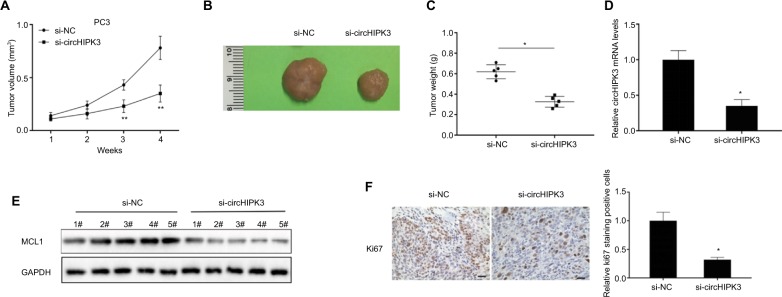
Figure 4.
CircHIPK3 silencing suppressed PCa growth in vivo.
Notes: (A) Tumor volumes were monitored every 1 week (Student’s t-test). (B) Representative tumors from two groups of nude mice after injection of si-circHIPK3 PC3 cells or controls cells. (C) Tumor weights were measured (Student’s t-test). (D) Relative circHIPK3 expression was detected in two groups of tumors by qRT-PCR (Student’s t-test). (E) Relative MCL1 protein expression was detected in two cell groups by WB. (F) Ki67 expression and relative positive cell numbers were determined by immunohistochemistry in each group (Student’s t-test). Scale bars: 20 µm. Quantified values were mean ± SD of at least three independent experiments. *P<0.05, **P<0.01.
Abbreviations: NC, negative control; WB, Western blot; qRT-PCR, quantitative real-time reverse transcription PCR.

