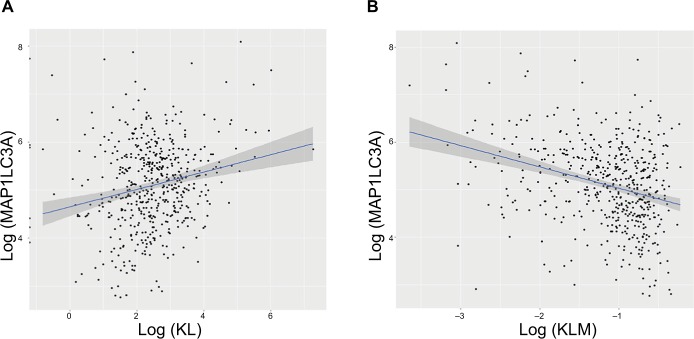
Figure 3.
Associations of KL expression and methylation with LC3 gene expression.
Note: Scatter plots and linear regression line (95% CI in shadow) show that high KL expression was positively associated with LC3, an autophagy gene (correlation coefficient =0.17, P=0.0003) (A), and that KL methylation was negatively associated with LC3 (correlation coefficient =−0.27, P=1.01e–12) (B).
Abbreviations: KL, klotho expression; KLM, klotho methylation.

