Figure 5.

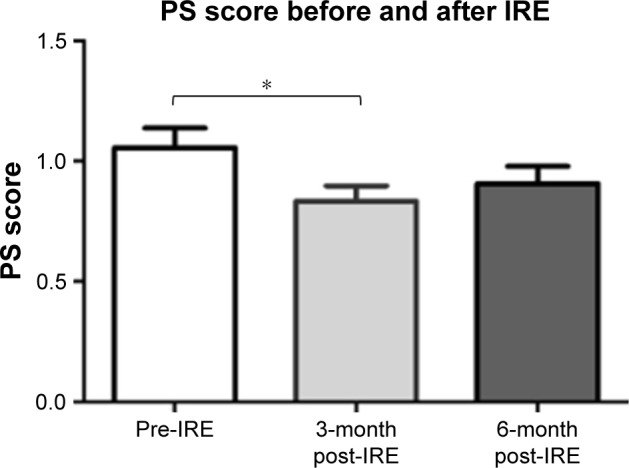
Error bar chart showing the performance status (PS) score before and after irreversible electroporation (IRE).
Note: *Significant difference (P<0.05).

Error bar chart showing the performance status (PS) score before and after irreversible electroporation (IRE).
Note: *Significant difference (P<0.05).