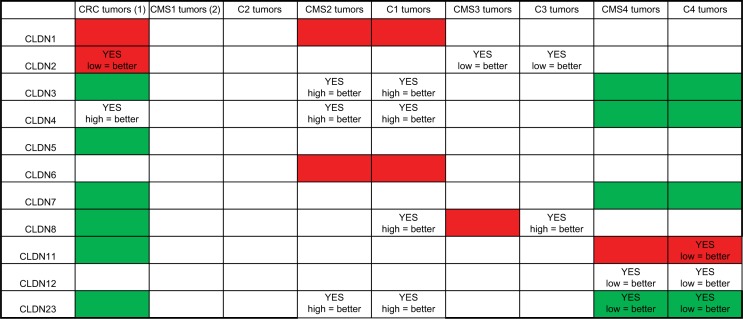
Figure 6.
Summary of CLDN gene expression and prognostic value in CRC.
Notes: (1) Expression in CRC samples (n=20) compared with normal mucosa samples (n=17); red = upregulated; green = downregulated; white, no expression difference with normal mucosa. (2) Comparison of CLDN expression in the different CRC subtypes; red = subtype where CLDN expression is strongest; green = subtype where the expression of that CLDN gene is lowest compared with the other subtypes; white = no expression difference among subtypes. YES indicates that the expression level of that CLDN gene shows prognostic value, with the correlation between CLDN expression level (high/low relative to the median expression of that gene) and improved prognosis.
Abbreviation: CRC, colorectal cancer.

