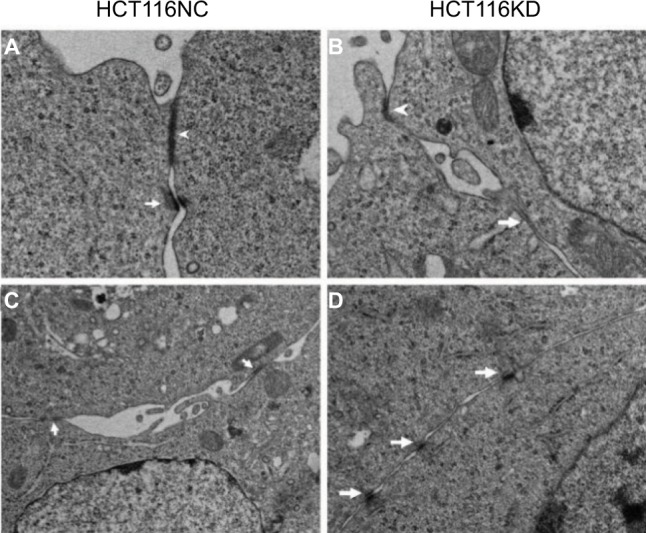
Figure 3.

Electron microscope results of HCT116NC and HCT116KD cells.
Notes: (A, B) The arrowhead indicates the apical tight junction between cells in HCT116NC and HCT116KD (magnification: 8000×). (C, D) The arrowhead indicates the lateral tight junction between cells (magnification: 5000×).
