
Fig. 4.
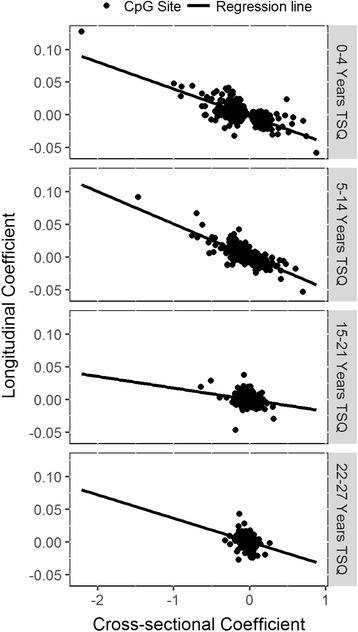
Cross-sectional coefficient vs longitudinal coefficient for each CpG site under investigation longitudinally. The panels display the results for TSQL category 1, category 2, category 3 and category 4, respectively. The longitudinal coefficients represent the rates of change of methylation M-value per year relative to never smokers. The cross-sectional coefficients represent the baseline difference in methylation M-value compared to never smokers