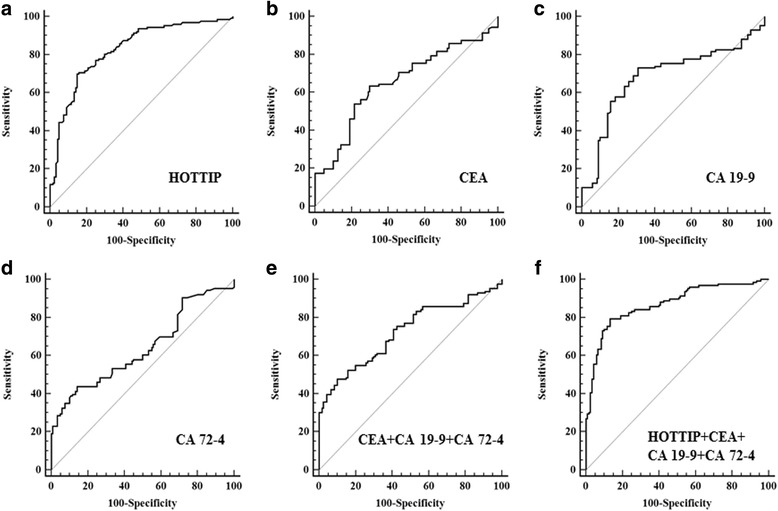
Fig. 1.

The ROC curves of biomarkers. a The ROC curve of exosomal HOTTIP. The area under the curve was 0.827. b The ROC curve of CEA. The area under the curve was 0.653. c The ROC curve of CA 19–9. The area under the curve was 0.685. d The ROC curve of CA 72–4. The area under the curve was 0.639. e The ROC curve of combine CEA, CA 19–9 and CA 72–4. The area under the curve was 0.723. f The ROC curve of combine CEA, CA 19–9, CA 72–4 and exosomal HOTTIP. The area under the curve was 0.870. P < 0.001
