Fig. 7.

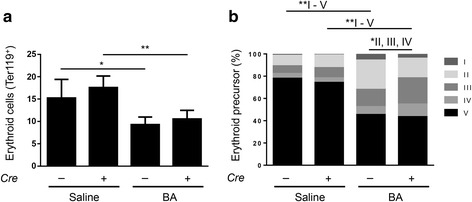
Bone marrow erythropoiesis depicted through total erythroid cells and distribution of erythroid precursor cell populations. a Total erythroid cells (Ter119+) in the bone marrow 14 days after heat-killed Brucella abortus (BA) or saline injection (*P = 0.03: Alk3fl/fl injected with saline [n = 4] vs Alk3fl/fl injected with BA [n = 6]; **P = 0.009: Alk3fl/fl; Alb-Cre injected with saline [n = 4] vs Alk3fl/fl; Alb-Cre injected with BA [n = 6]). b Erythroid subpopulations in the bone marrow of Alk3fl/fl and Alk3fl/fl; Alb-Cre mice 14d after BA administration (V and II: *P = 0.01: Alk3fl/fl injected with saline vs Alk3fl/fl injected with BA; III: *P = 0.01: Alk3fl/fl injected with saline vs Alk3fl/fl injected with BA; III and V: *P = 0.01: Alk3fl/fl; Alb-Cre injected with saline vs Alk3fl/fl; Alb-Cre injected with BA, II: P = 0.01: Alk3fl/fl injected with BA vs Alk3fl/fl; Alb-Cre injected with BA; III: P = 0.01: Alk3fl/fl injected with BA vs Alk3fl/fl; Alb-Cre injected with BA). [Subpopulation V = terminal differentiated red cells, IV = orthochromatic erythroblast, III = polychromatic erythroblast, II = basophilic erythroblast, I = proerythroblast]
