
Figure 10.
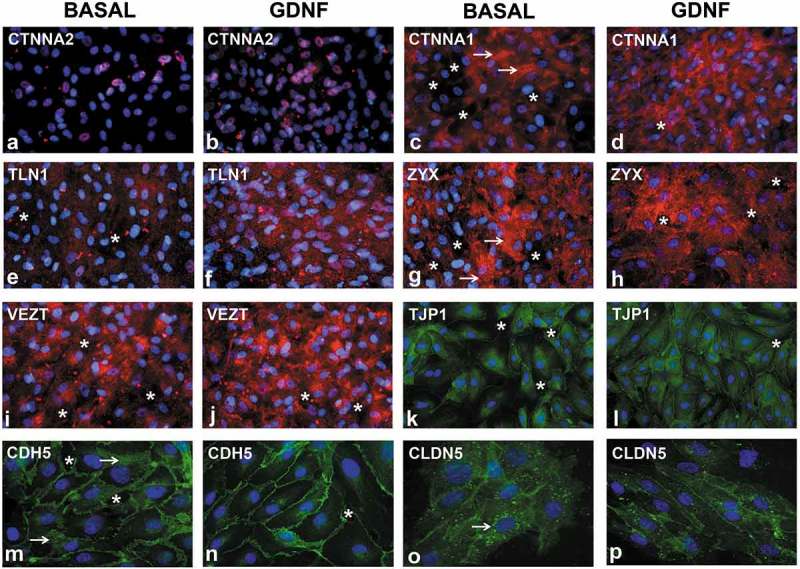
Effect of GDNF on selected human BNB junctional complex proteins following serum withdrawal. Representative digital indirect fluorescent immunocytochemistry photomicrographs of visually confluent pHEndECs in vitro 48 hours after serum withdrawal shows restricted nuclear CTNNA2 expression in GDNF-untreated (basal, A) and treated cultures (B) with foci of intense cytoplasmic CTNNA1 expression in basal (white arrows, C) compared to more diffuse increased cytoplasmic CTNNA1 expression following GDNF (D). Diffuse punctate cytoplasmic TLN1 expression seen under basal conditions (E) contrasts with more intense diffuse staining seen following GDNF treatment (F). Foci of intense ZYX expression associated with intercellular cytoplasmic projections is seen under basal conditions (white arrows, G) compared to less intense and uniformly more diffuse expression following GDNF treatment (H). Contrary to the PCR array data, there is reduced focal perinuclear and cytosolic VEZT expression under basal conditions (I) compared to GDNF-treated cells (J). Less organized intercellular junctions expressing TJP1 are seen under basal conditions (K) compared to GDNF treatment (L). Similarly, less organized intercellular junctions with broader CDH5 membrane expression is seen under basal conditions (white arrows, M) compared to GDNF-treated pHEndECs (N). CLDN5 intercellular junctional expression is less organized and associated with more intense punctate perinuclear cytoplasmic staining under basal conditions (white arrow, O) compared to expression on more continuous and organized intercellular junctions with GDNF treatment (P). Intercellular gaps (white asterisk), which are more prevalent under basal conditions compared to GDNF-treated pHEndECs, are shown. Positive protein expression = red in A-J and green in K-P, with nuclei depicted in blue. Initial magnification 400X for all photomicrographs.